
Illustrative stock photograph; it does not depict an interviewed customer, a measured billing account or this calculator’s results.
Use this service pricing calculator to turn a realistic delivery capacity, per-job costs and monthly obligations into a planning price. It rounds capacity down to whole jobs, keeps monthly costs separate from per-job costs and shows target income without calling it guaranteed profit. Change the assumptions before treating the output as a quote.
The calculator runs in this page in your browser. It does not submit or save your entries. All default amounts and the worked example are fictional USD assumptions, not market rates. Use one currency consistently. Tax, payment-processing fees, refunds, bad debt and financing costs are excluded unless you deliberately include them in the appropriate cost input.
Enter a delivery unit you can finish
A job must mean a repeatable deliverable: for example, one defined reporting package, including its agreed revision and handoff. If two projects have very different delivery needs, calculate them separately. An average that hides a large project can overstate how many jobs you can accept.
Enter monthly working hours, then remove administration, marketing, sales, leave and other time not available for this delivery work. The tool does not infer billable utilization from a total working month. Add preparation, client communication, revisions and handoff to the hours per completed job when those belong to the delivery unit.
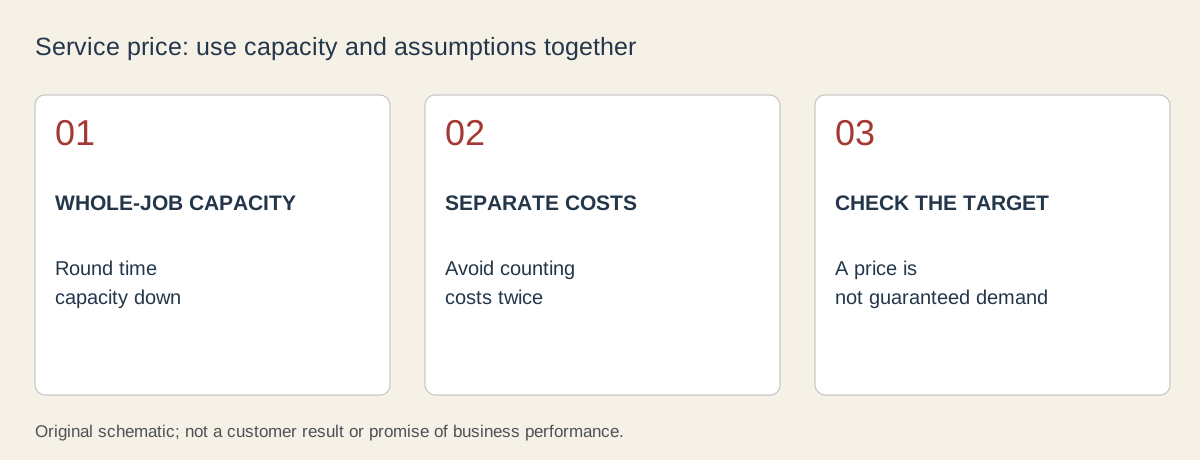
Capacity = floor((working hours − non-delivery hours) ÷ delivery hours per job). Planned completed jobs must be a whole number no greater than that capacity. Available time does not prove demand: you can have room for nine jobs and only expect to sell six.
Keep per-job and monthly costs separate
Per-job direct costs vary with another completed job, such as a specifically purchased input or subcontractor charge. Monthly costs cover the period rather than another job, such as a subscription or rent. Allocate them once. A contractor payment must not appear both as a direct cost and again inside the monthly total.
The ACCA explanation of cost-volume-profit analysis separates fixed costs, variable costs, revenue and contribution. Our tool applies transparent arithmetic to a single service planning unit. It does not validate your cost classification, replace accounts or establish a professional pricing recommendation.
If you put your own delivery wage in the direct cost, do not ask the income target to fund the same wage again. The owner-income input below is a planning amount still to fund, not a tax calculation or an extra wage automatically owed to someone.
Choose two different targets deliberately
The monthly owner-income target represents compensation you want the business to support before personal tax. The business-surplus target is a separate planning buffer after the entered direct costs, monthly costs and owner-income target. It is not a guarantee of accounting net profit.
Required monthly revenue = planned jobs × direct cost per job + monthly costs + owner-income target + surplus target. Planning price per job = required monthly revenue ÷ planned jobs. The displayed price rounds upward to a cent so display rounding does not underfund the entered target. The output assumes every planned job is completed and paid at that price.
If you already have a quoted price, compare the expected monthly revenue at that price with the target. The tool shows the amount remaining after entered costs, and the gap after the owner-income target. A positive number does not mean omitted taxes, unpaid invoices or unrecorded work disappear.
Try the calculator
Use the calculator below, then copy the assumptions into the blank service-pricing record. If scripting is disabled, the formulas and complete worked example remain available in this article. The standalone calculator page uses the same calculation and can be saved locally.
Service planning calculator
Fictional USD defaults. Entries stay in this browser page; no submission or saving.
Results exclude unentered tax, fees and unpaid work. They are a planning model, not a profitability promise.
The calculator rejects a zero delivery time, negative cost or target, a fractional planned-job count, and planned jobs above available capacity. A zero-job month has no meaningful per-job target price, so it asks you to revise the plan rather than dividing by zero. Increasing the income target cannot create more hours or customers.
Worked example with deliberately incomplete capacity
Assume 120 working hours, 40 non-delivery hours and 9 delivery hours per completed job. Available delivery time is 80 hours. Dividing by 9 gives 8.88 recurring jobs, so physical capacity is 8 whole jobs, not 9. The remaining 8 hours are unallocated capacity, not another completed job.
Plan for 6 paid jobs. Direct cost is $30 per job, monthly costs are $600, owner-income target is $2,400 and surplus target is $300. These are hypothetical assumptions for demonstrating the tool; they are not a record of an actual business.
| Calculation | Amount |
|---|---|
| Direct costs for 6 jobs | 6 × $30 = $180 |
| Monthly costs + owner income + surplus | $600 + $2,400 + $300 = $3,300 |
| Required monthly revenue | $180 + $3,300 = $3,480 |
| Planning price per job | $3,480 ÷ 6 = $580.00 |
| Revenue after direct and monthly costs | $3,480 − $180 − $600 = $2,700 |
| Remaining after owner-income target | $2,700 − $2,400 = $300 |
At a $500 quote, six completed and paid jobs generate $3,000. After $180 direct costs and $600 monthly costs, $2,220 remains, which is $180 below the owner-income target and $480 below the combined income-and-surplus target. The model exposes that gap; it does not tell you that customers will accept $580.
Profit margin and markup use different denominators
For a simple separate example, a service with a fully specified cost basis of $100 sold for $125 has a $25 difference. Markup on that cost is $25 ÷ $100 = 25%; margin on sales is $25 ÷ $125 = 20%. A 25% markup is not a 25% margin.
The calculator reports the entered revenue and cost differences rather than labeling them net profit. Your owner-income target might be treated differently in accounts depending on business structure and jurisdiction. Ask a qualified accountant about tax and accounting treatment; this planning model does not decide that classification.
Check break-even jobs against capacity
At a quoted price above the direct cost per job, contribution per job is price minus direct cost. Covering just the entered monthly costs needs ceil(monthly costs ÷ contribution) whole jobs. Funding monthly costs plus the owner-income target needs ceil((monthly costs + owner income) ÷ contribution). Both remain subject to the capacity and actual-sales constraints.
With the fictional $500 quote, contribution is $470. Monthly-cost break-even is ceil($600 ÷ $470) = 2 jobs. Funding monthly costs and $2,400 owner income needs ceil($3,000 ÷ $470) = 7 jobs. That is within the eight-job capacity but above the six jobs currently planned. Do not replace the demand forecast with seven merely because the formula produces it.
If price is equal to or below the per-job direct cost, this break-even formula cannot fund a positive monthly obligation. The tool states that limitation instead of returning a negative job count. It uses whole-job ceiling for an obligation and whole-job floor for capacity; those two rounding directions serve different purposes.
Turn the result into a decision
Recheck the delivery scope, true capacity, payment assumptions and missing costs. Compare a lower-demand month before increasing commitments. The pricing logic guides cover the surrounding business decisions; a calculator cannot choose your market position or establish willingness to pay.
Save the date and the assumptions, then compare them with completed work and received payments. Update the record when delivery time, input cost, capacity or scope changes. The useful result is an explainable planning price and a visible gap, not a claim that one formula ensures profitability.
The hidden delivery cost guide helps identify work omitted from an initial quote. Add that work to time or costs deliberately before using the calculator, rather than assuming a spare hour will absorb it.